|
|
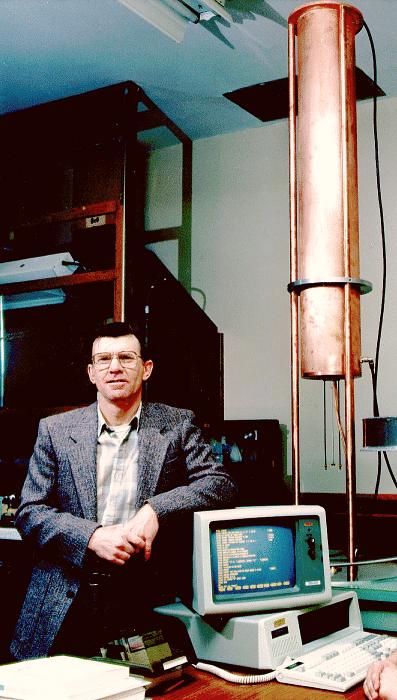
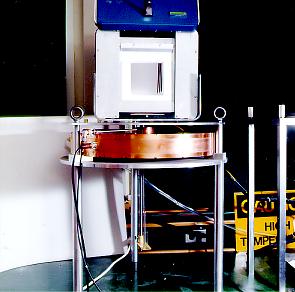
A SYSTEM FOR MEASURING THE COMPLEX SUSCEPTIBILITY OF SMALL SAMPLES AT HIGH TEMPERATURES A system has been developed, based on the cavity perturbation technique, for measuring the complex scalar permittivity of materials at frequencies between 50 MHz and 3 GHz, and up to a temperature of 1400° C. The system is suitable for measurements on most classes of materials, including metallic oxides, conventional and advanced ceramics, fabrics, earthenwares, geological and biological materials, foods, glasses, organics and ferrites, and measures the complex dielectric constant of materials during conventional heating, curing or sintering. A hot sample and its holder are rapidly removed from a conventional furnace and inserted into a high electric field region of a thick-walled, well-cooled cavity. The resonant frequency and loaded Q of the cavity are measured by a Hewlett-Packard 8753 network analyzer and stored for off-line analysis which includes subtraction of hot empty sample holder effects. The sample and holder are either left in the cavity for further measurements at lower temperatures as the sample cools, or are quickly returned to the furnace for further processing. In the latter case, the sample can be out of the furnace for as little as 2 seconds for a measurement at a single frequency. The data analysis uses the general formalism of resonant cavity frequency shift theory, in which the real and imaginary parts of the complex electric susceptibility, c = er - 1, are related, through functions dependent on sample shape, to the change in cavity resonant frequency and Q [1,2]. The absolute calibration is normally done at room temperatures, and uses measurements on known high purity materials (similar to ASTM Standard Test Method, D2520-86, Method C). For sample geometries for which calibration materials are not available (e.g., thin films), comparison is made with calculations of the frequency shift and Q using the 2-D code SEAFISH [3]. Multimode Cavities for Multifrequency Analysis The peak-analysis and frequency-agile abilities of the HP 8753 network analyzer allow measurements of frequency and Q at half a dozen frequencies in less than ten seconds. To take advantage of this capability, a cavity was required with good higher-order-mode separation (at least to sixth order) and with relatively uniform field in the sample region. Two cavities were built to meet these requirements, a quarter-wave coaxial resonator and a right cylindrical TMono resonator. The coaxial resonator is approximately 1.5 meters long (fundamental frequency of 54.5 MHz), and is made of 230 mm (9") outer diameter high power copper coaxial transmission line Fig.1). The hot cylindrical sample (30 mm long, 5.5 mm diameter) and holder are inserted along the axis into the electric field at the open gap end. The copper walls in the region of the gap are water cooled. All coaxial modes up to and including the sixth mode at 600 MHz are cleanly separated from other resonant frequencies. The TMono resonator (Fig. 2) is a 580 mm (23") diameter, 50 mm long right cylindrical cavity (fundamental mode at 400 MHz) which, with a 12 mm long, 3.5 mm diameter sample inserted along the axis, has clearly separated modes up to a n=6 at 2970 MHz. The cavity is a furnace-brazed, thick-walled OFHC copper structure with cooling channels machined into the central axial region which is exposed to the high temperature sample and sample holder. The unloaded Q of this cavity is approximately 10 000 at 400 MHz and increases to over 30 000 for the n=6 mode. The thermal transient produced by inserting the hot sample produces small shifts in frequency, but the effect of these is minimized by doing the hot empty sample holder measurements with the same time delays and frequency sequences used during measurements with samples. The Data Analysis Formula ce= ce´ - j ce ² may be determined from resonant-cavity perturbation measurements using the following equation: fE, QL,E are the cavity frequency and loaded Q, with the empty holder, Df is the frequency shift produced by the sample, QL,S is the loaded cavity Q, with the holder and sample, Fsh is a real number dependent only on the sample shape, Vs and Vc are the sample and cavity volumes, A is a real calibration constant dependent only on the shape of the electric fields in the absence of the sample. The two calibration constants in the formula, A and Fsh can be determined either by comparison with computer simulations or by comparison with known samples. Solid or liquid calibration samples are used, depending upon whether the sample material is liquid (or a tamped-in powder) or solid (carved or cut sample or pressed pellets). Note that both the real and absorptive parts of the susceptibility are given by Eqn. 1, even though the calibration constants are real and may be determined by measurements on low loss materials. For large ½ce½, the fractional frequency shift reaches a limiting value which is independent of the dielectric constant. Thus a high conductivity (high ce²) sample can be used as one calibration point. For solid calibrators, single crystal, high-purity sapphire er´ = 11.54 with electric field parallel to the C-axis, er´ = 9.34 perpendicular to C-axis) may be used for the second calibration point, with teflon (er´ = 2.07) used as a check at low dielectric constant values. The error of this calibration technique for the present sample length to diameter ratio (»3.5) was shown to be less than ± 3% for er £30 and tan d £1 by comparing the results of Eqn. 1 with numerical calculations using the code SEAFISH. For liquid calibrations, non-polar materials with very low frequency dependence can be used (cyclohexane, carbon tetrachloride, benzene ) for the low dielectric region (Ref.4), while polar materials ,such as acetone and methanol (Ref. 4 ,5 ) may be used for the higher dielectric constant region. In the present case cyclohexane (er´ = 2.04 , er´´» 0 ) and methanol (Cole-Cole equation with es= 33.9, e¥ = 4.42, f0 = 3.121 GHz, a = 0.04 ) were used. Sample Holder Considerations and Sample Preparation Methods Rapid movement of the sample in and out of a high temperature furnace requires the sample holder to be relatively insensitive to temperature gradients and to high cooling and heating rates. High purity amorphous silica can tolerate these conditions as well as being inert in air up to 1600°C. Thus, at present, the sample holders for high temperature work are made from amorphous silica tubes, 1 mm wall thickness, and 6.0 and 4.0 mm inner diameter for the low and high frequency cavities, respectively. A 1 mm thick flat bottom is fused into the tube to support the sample. Teflon sample holders are used for low temperature studies. High purity, low OH content amorphous silica has er´ = 3.8 and tan d@ 10-4 at room temperature. However at high temperatures (>1000 °C), both er´ and the losses increase significantly, and their contribution to the cavity frequency and Q shift value must be included. Before a measurement with a sample, the empty holder values are measured at 100°C intervals up to the maximum planned temperature. They are later subtracted from the sample measurements assuming the sample and empty holder shifts add linearly. In (Fig. 3) is shown the apparent increases of ce´ and c² that would occur when using the TMono resonator with a standard size sample, if the change in sample holder properties were not taken into account. The sample-holder effect may be removed in the analysis, but making this correction introduces additional experimental error in er´ and er². At 1400°C, the error in er´ is less than 5% for materials with er´ > 2, and the error er² is less than 5% for er² > 0.1. When measuring the properties of low-loss materials at high temperatures, the error can be minimized by removing the sample and immediately measuring the empty holder values at the same high temperature. The use of the amorphous silica holder is limited by two effects: 1) the gradual nucleation and re-crystallization to cristoballite above 1000°C, and 2) chemical and physical interaction with the sample, particularly if the sample contains mobile or reactive metal ions. The former effect results in heavy "frosting" of the surface of the tube and, although there is very little change in the dielectric properties, embrittlement and cracking of the holder will eventually occur. Holders have survived over two hours at 1500°C, with measurements every fifteen minutes. Chemical interaction with the holder is a function of the number of physical contact points; thus pressed pellets of reactive material can often be measured with insignificant contamination of the holder, while powder packed in the holder, produces intolerable reaction. Samples are usually prepared either by diamond core drilling of solid material or by pressuring powders into self-standing pellets. Non-reactive materials may be used in powder form. During the last two years we have made measurements on a broad selection of materials to give us practical experience with many different sample types. This has given us a better understanding of the abilities and limitations of the apparatus and technique, and has revealed a few areas of study to which the system is especially suited. One point in particular that constantly recurred was the variability in dielectric properties from sample to sample, both in composites (due to lack of homogeneity) or in pressed compacts or powders (due to density variations). It became clear that studies of temperature dependence and particularly of frequency dependence would have better accuracy and be easier to interpret for mechanistic studies if all measurements could be done on a single sample. This is especially true of measurements intended to mimic a materials processing step (such as microwave heating and curing) where the sample property changes are inherently irreversible. Data Presentation , Tand and Electric Field Attenuation Length The fundamental properties measured by the system are the real part of the dielectric constant, represented by the symbol e ¢ or ep, and the imaginary or absorptive part of the dielectric constant, represented by e ¢¢ or epp. Plots of these quantities versus temperature are the basic data generated by the present cavity measurement system. Many customers are interested in or require two secondary quantities which are derived from the values of the complex dielectric constant of a material :

The power carried by the fields decreases as a function of depth ( power is proportional to E2 ), and the formula shown above gives the power carried by the wave as a function of depth. When the wave penetrates a distance equal to the inverse of the attenuation constant , the power in the wave is decreased to 13.5% of its initial value .
The rate of power deposition in the material per unit depth is then proportional to 
When the value of tand is very large , the expression for a-1 reduces to 
For a very conductive material, 
and , with c-2= m · e the expression may be shown to be exactly that for the skin depth. AC Electrical Conductivity and Activation Energy Determination For the situation of a very electrically conductive material, the expression given above for e¢¢ may be used to derive the ac conductivity at a specific frequency. If the conductivity is a result of electronic conduction (as opposed to ionic), it is usually independent of frequency, and the formula also gives the correct frequency dependence. The electrical conductivity of a solid usually increases as the temperature increases, and most theories result in some form of Arrhenius-type activation energy dependence. The following formalism can be used to fit e¢¢ as a function of temperature, and thus to determine the value of Eg/2, the activation energy. The value Eg is the gap energy used in the semiconductor conduction formalism. The usual activation energy ( referenced to kT) is Ea= Eg/2 . 
where f is the frequency in MHz, and T is the temperature in degrees Celcius. References
|